Spain Open Data
Ask Claude where to open a business in Spain, and get answers from public data, sourced down to the neighbourhood.
Try it in Claude
- In Claude, open Settings, then Connectors.
- Choose “Add custom connector” and paste this URL:
https://spain-open-data-mcp-165703905656.europe-west1.run.app/mcp - Ask a question, for example: “I lead expansion for a mid-size gym chain. We want our next 3 sites in Madrid.”
Or run it locally: uvx spain-open-data-mcp
Overview
An open-source MCP server that lets Claude answer business questions about Spain from public data: market size, income, competitors, rents and crime, down to the neighbourhood, with every figure sourced, dated and checked. I scoped, directed, reviewed and tested it. It was built with Claude Code as my engineering pair, in public, over three days.
The problem
Spanish public data can answer “where should I open X, and how big is the market?” The census, household income, the company directory and OpenStreetMap all hold part of the answer.
But it is scattered across INE, OpenStreetMap and the national open-data catalogue, and it is coded: INE numbers districts, it does not name them. It is also full of traps: suppressed cells, incomplete maps and stale years.
The person I built it for is a strategist or founder sizing a market or choosing a location in Spain, who needs a number they can defend.
What it does
13 tools and 3 ready-made prompts. The ones that matter most:
- Place resolver: turns “Parquesol, Valladolid” into the right INE codes.
- Demographics, income, businesses and chains for any municipality, district or census tract.
- Market size in euros, with low, base and high ranges.
- Compare areas, a walking catchment around an address, price band, rents and recorded crime.
- Charts, plus search and reading of datos.gob.es.
Sources
- INE: census, Padrón, household income atlas, household spending survey, company directory, rent index and tourism.
- OpenStreetMap, from a monthly snapshot.
- Interior ministry crime statistics.
- datos.gob.es, the national open-data catalogue.
How I made it trustworthy
Every figure can be checked.
Sourced and dated.
Every answer carries its sources, the data year and a confidence level, and ends with “Sources and caveats”.
Checked before it is said.
The server flags suppressed values, thin samples, stale data, estimates and map gaps, so Claude states them instead of hiding them.
Private by design.
Aggregate data only, and requests about individuals are declined. Addresses go only to Spain’s official geocoder, with floor and door removed, and are never stored. Datasets have personal-data columns withheld.
Neighbourhoods, not codes.
63,674 OpenStreetMap names placed in INE census tracts, so 3,351 districts and about 26,000 tracts are named: “Valladolid distrito 10 (Parquesol, Girón, La Victoria)”. “Parquesol, Valladolid” works as a search.
Data engineering that fits.
INE’s 1.6 GB census file (14.9 million rows) reduced to a 2.6 MB download with every tract’s age and sex profile.
Evidence
The test set has 38 questions with hand-checked answers. Populations and incomes were checked against INE’s raw API, independently of the server’s code.
Layer 1 tests the server against live data: 36 of 36 tool-backed questions pass, and it runs weekly. Layer 2 tests Claude answering through the server:
| Measure | Result |
|---|---|
| Required numbers present | 100% (26/26; 87–100%) |
| Rubric items met | 96% (81/84; 90–99%) |
| Sources named | 100% (35/35; 90–100%) |
| Ranges and caveats stated | 100% (16/16; 81–100%) |
| Personal-data requests declined | 100% (9/9; 70–100%) |
The model grader is the same model as the one answering. So I read 10 of the answers myself, one or two of each kind, drawn at random, and scored each out of 10. All scored 8.5 or higher, including two of the three answers the model grader marked down. Facts were rescored once after a checker bug read 3.6 as 36; the answers and rubric grades are from the original run. Its limits: one grader (me, the author), per-answer scores, and a sanity check rather than a measured agreement rate.
A result against my own model
I checked the opportunity score (market per competing business, against the region) against INE’s business openings for the first half of 2026. Ranking provinces by population alone did better in 15 of 19 categories. The score did better only for childcare, gyms, private schools and vets.
It is a dry run on quarters published before the score was registered, so it tests the pipeline, not the score. Provinces are also coarse, and retail is one INE category. The pre-registered forward test reports in mid-2027. The tool now says in every answer that the score is not a forecast.
I published a result against my own model and changed the product because of it.
What real use changed
A company expansion decision.
A gym chain in Madrid, 18 October 2026, through the hosted connector. The question: “I lead expansion for a mid-size gym chain. We want our next 3 sites in Madrid.”
Sized the market
What Claude did
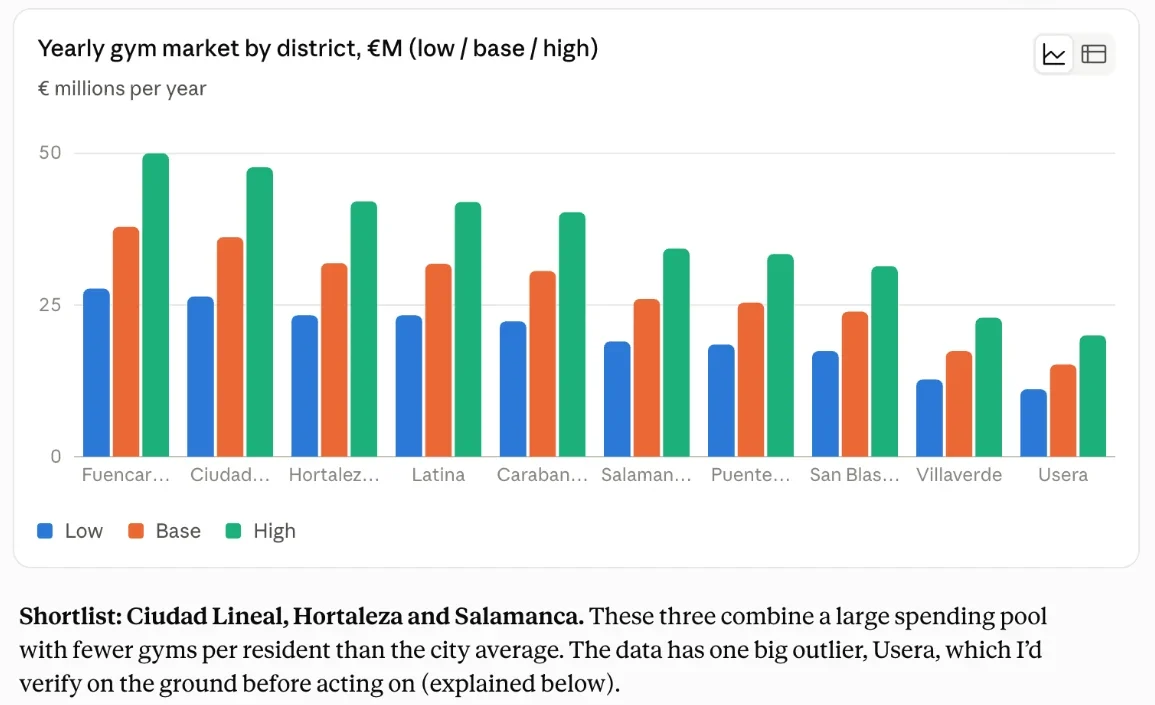
Ranked all 21 districts by yearly gym market (€7.8M to €37.9M), gyms mapped per 10,000 residents, income and population.
Shortlisted three, with trade-offs
What Claude did
Ciudad Lineal: the largest under-supplied market, €36M a year, 0.62 gyms per 10,000. Hortaleza: incomes above the city’s, many families. Salamanca: premium incomes, 0.76 gyms per 10,000 against 1.3 to 1.4 in neighbouring districts.
One slip, stated openly
It called Hortaleza’s share of children (19.2%) the highest of any large district; Villa de Vallecas (19.7%) is higher.
Said what it could not know
What Claude did
Refused to rank Usera, whose single mapped gym for 143,000 residents is almost certainly a gap in the map, not in the market. Listed what the data cannot show: gym size and price tier, office workers, rents, footfall.
Earlier conversations in Valladolid mixed district and walking-area figures in one comparison; the server’s instructions were changed to prevent it (version 0.1.4).
Engineering and shipping
- Python and the official MCP SDK: stdio locally, Streamable HTTP when hosted.
- Google Cloud Run in the EU: scales to zero, at most 2 instances, on the free tier with a budget alert. Host-header checks and per-address rate limits. A Docker image with all data baked in.
- CI on GitHub Actions: tests on Python 3.11 to 3.13, type checks, lint, a gitleaks secret scan and an image smoke test.
- Scheduled jobs refresh the OpenStreetMap snapshot and the atlas monthly, and open an issue when new crime data is out.
- Published to PyPI and the official MCP Registry (io.github.digvijaysingh-ai/spain-open-data-mcp) through tokenless trusted publishing.
- Built in public with issues and small pull requests, from 15 to 17 October 2026.
Next
- Run the registered validation in 2027 and report it either way.
- Add income for the Basque Country and Navarra, which publish separately.
- A larger, independently graded eval sample, and a submission to Anthropic’s connectors directory.
Data: Fuente: INE. Elaboración propia con datos extraídos del sitio web del INE (CC BY 4.0). © OpenStreetMap contributors (ODbL 1.0). Data as of 2026-10-16. Outline: Natural Earth (public domain).
Works with Claude. An independent project: not endorsed, sponsored or partnered by INE, OpenStreetMap or Anthropic. Code under the MIT licence. Built with Claude Code as my engineering pair; the scope, review and testing are mine.