Growth OS
An AI growth team that finds what is costing money, gets sign-off from the right person, and acts.
Overview
A team of AI agents that runs the part of a growth team’s week that dashboards leave to people: spotting what changed and why, deciding, getting sign-off from the right person, making the change, and checking whether it worked. Built and tested on a synthetic consumer brand with 12 markets, 4 product lines and about €3.3M of marketing a month, driven by real weather and public holidays.
At a glance
- 37 · 35 · 39graded checks out of 45 on three businesses none of them had seen: the agent team, one Claude call given every tool’s output, and a rules checklist with no AI. The simpler setups match the teamHeld-out eval
- 0actions without a person’s approval. Role checks, four eyes on risky changes, budget caps, kill switch, audit log, rollbackBy design
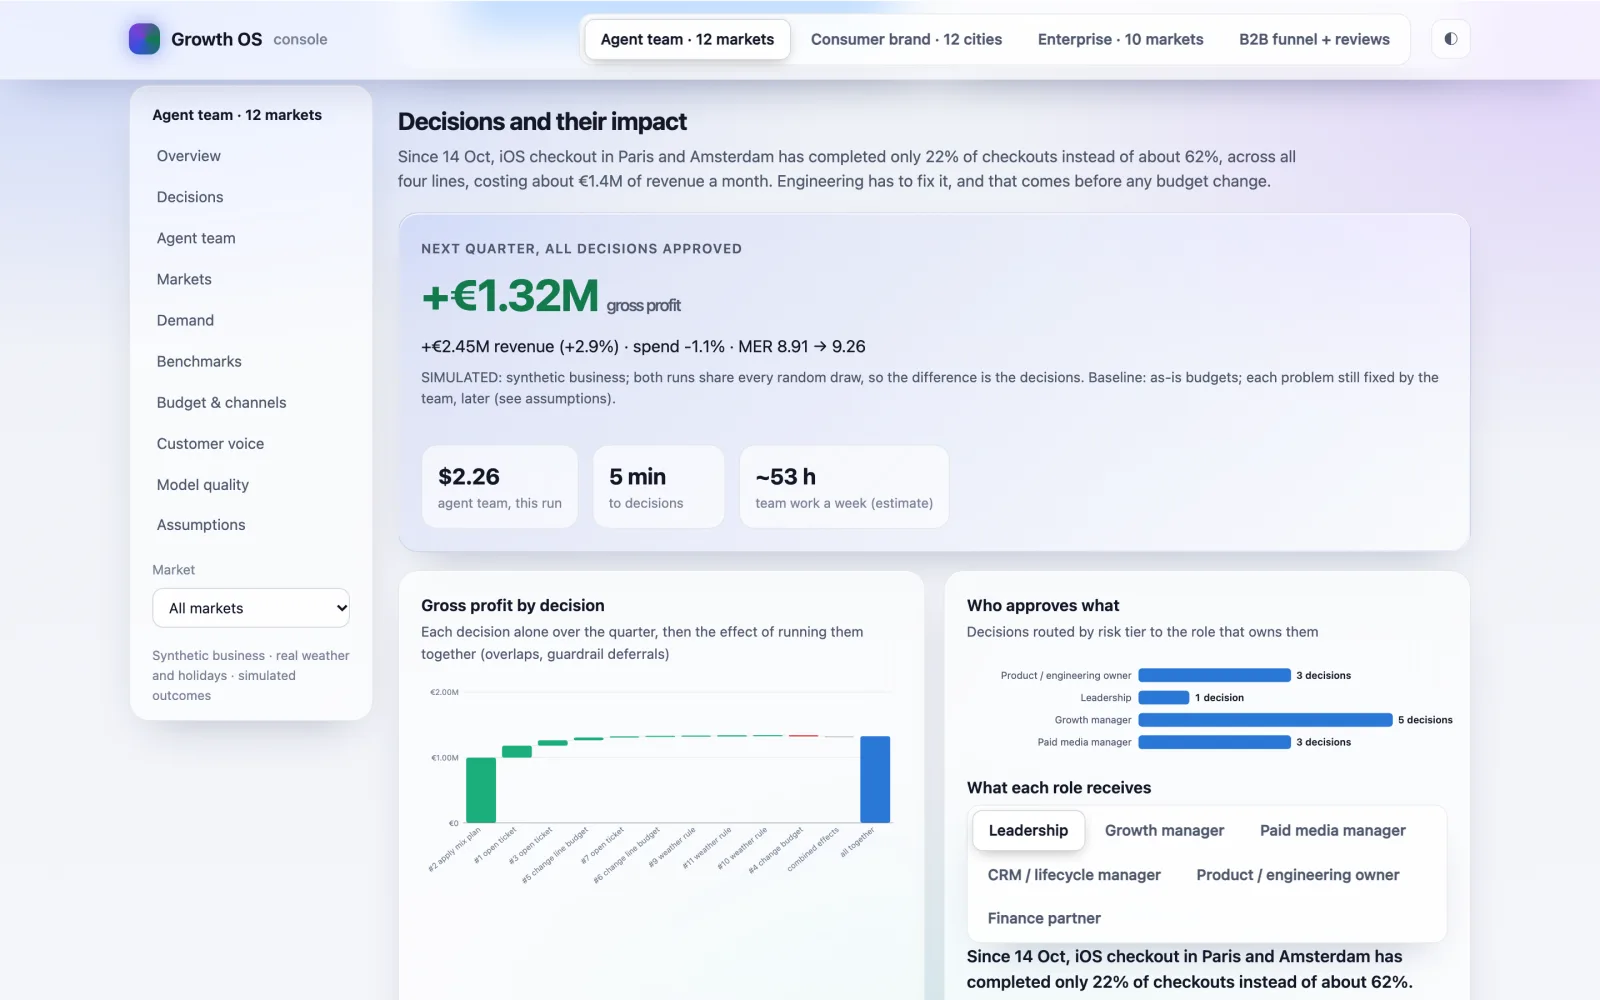
- +3.9%gross profit after marketing next quarter on the showcase business, with every decision approved, on 1.1% less spend (revenue +2.9%)Simulated · synthetic €3.3M-a-month business
- 8.91 → 9.26MER: revenue for every euro of marketingSimulated
- 5 min · $2.26for a full weekly run: six agents, 99 tool calls, 12 decisions routed to five rolesMeasured
- 41/45the team’s checks as graded by a person, against 37 by the AI grader: they agree on 82% of checksGrader check
How to read these numbers
The fairer read is the held-out eval: three businesses the agents never saw, with their problems planted in different markets, lines and devices. There the team passed 37 of 45 checks and gained +2.7% to +4.6% of gross profit. Then came the test most agent demos skip: the same businesses, grader and simulated quarter for two simpler setups. They did as well. The scores were measured while those three seeds were private; publishing the code makes them public, so the next held-out claim will use new ones.
The showcase business is the one in the console. Its problems were planted on purpose, so its +3.9% (+€1.32M of gross profit in the quarter) is an upper bound for a business built to contain them. For scale: that gain equals 13.8% of the quarter’s marketing spend.
Does the team beat simpler setups? Simulated
Three setups on the same three held-out businesses, graded by the same AI grader in one pass and priced by the same simulated quarter.
| Setup | Checks · gross profit next quarter · model cost a week |
|---|---|
| Agent team: a lead and four specialists choosing their tools | 37/45 · +2.7%, +4.6%, +3.9% · about $2.50 |
| One Claude call, given every tool’s output up front | 35/45 · +3.4%, +4.2%, +4.4% · about $1.90 |
| Rules checklist, no AI | 39/45 · +3.4%, +4.2%, +3.9% · $0 |
No. The tested engines (statistics, benchmarks, the mix model) and the action catalogue are shared by all three, and they do most of the work: once their output is on the table, one well-instructed call finds about as much as a team. The checklist is a strong baseline, not a naive one, because its author knew which kinds of problem the generator plants. What this benchmark cannot test is a problem nobody listed in advance, which is where judgement over the same tools has to earn its cost. That is the next test.
The problem
Large growth teams already have the warehouse and the dashboards. What eats their week is everything after the dashboard. With 12 markets, 4 product lines, 8 paid channels plus organic, email and SMS, there are too many combinations to check by hand, so the long tail is never looked at, budgets follow last quarter’s split, and each platform reports a different version of the truth.
Leadership asks “are we on plan, where is money leaking, what needs my sign-off?” and gets the answer late, in a deck. Managers spend Monday reconciling numbers instead of deciding. Workflow and automation teams see every decision turn into a manual chain: export, analyse, message, approve, change the platform, remember to check later. Nothing is logged end to end, and nothing is reversible by design.
The idea: do not build another dashboard. Build the team that works the dashboard: it finds the problem, sizes it in money, proposes one concrete action, gets the right person to approve it, runs it, and measures it.
An agent team, one job each
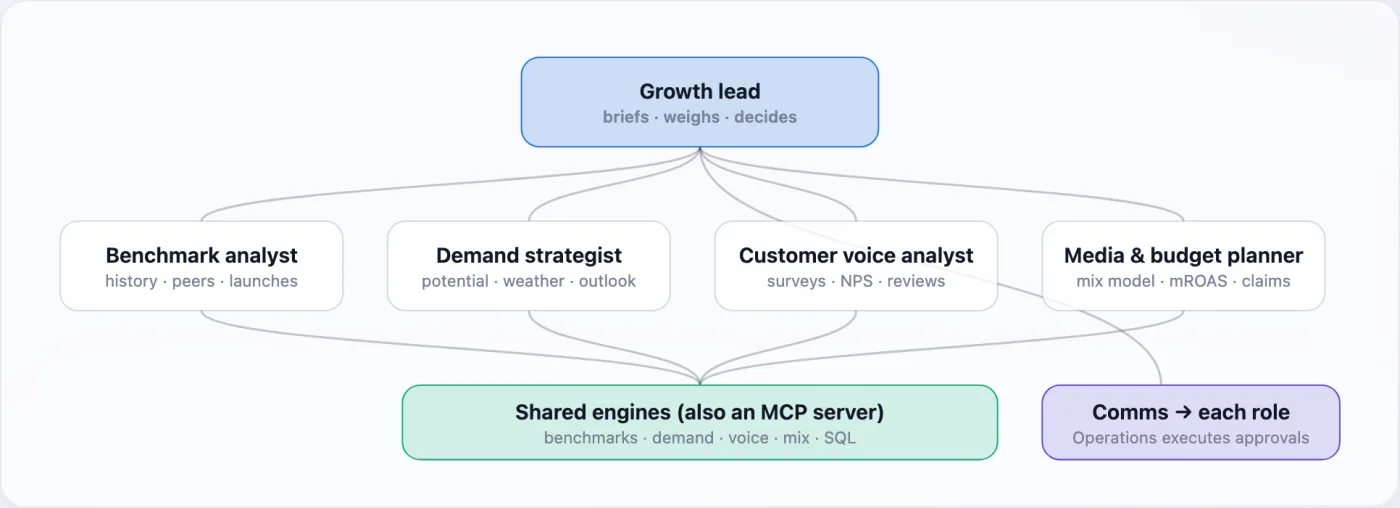
Six Claude agents with dedicated roles share one set of tested engines. The same engines are served as an MCP server, so a manager can ask the questions the agents ask straight from Claude.
- Benchmark analyst. Compares every market with its own same weeks last year, with peer markets of a similar profile and with earlier launches at the same age, and reports what is outside the normal range, and what only looks bad.
- Demand strategist. Estimates how much demand each market and product line has (category search interest, market profile, real weather and public holidays), how much of it the brand captures, and what the next 14 days of forecast weather will do.
- Customer voice analyst. Reads survey answers, NPS comments, reviews and support tickets in six languages, labelled by Claude Haiku, and finds themes unusually frequent in a market, like late deliveries or failed payments.
- Media & budget planner. Uses a marketing-mix model fitted on 60 weeks of budget changes to find channels past saturation, channels that mostly collect buyers who would come anyway, and where the next euro earns most.
- Growth lead. Briefs the four specialists in parallel, joins their findings, drops what is noise or seasonal, and decides. Every recommendation is one executable action with the money at stake, the role that must approve it and a metric to check it later.
- Stakeholder comms. Writes one short message per role (Leadership, Growth manager, Paid media, CRM, Product, Finance): what changed for them and what they must decide.
- Operations. Rules, not a model. Runs only what was approved, with the approver’s role verified, a second person for risky changes, budget caps, a kill switch, an audit log and rollback.
Key design decisions
Where the judgement is.
Actions, not insights.
Every recommendation must name one action from a fixed catalogue (move budget between channels, change a line’s budget, a rain rule, pause a channel, a ticket for engineering, ops or SEO, an A/B test, a message to a role) with a real target. A decision naming a market or channel that does not exist is sent back to the agent.
Problems go to whoever can fix them.
A payment failure on one device goes to engineering as a ticket with the evidence, not to marketing as a budget cut. Late deliveries go to logistics.
Approval is routed by risk.
Low-risk changes go to the channel owner, budget moves to the growth manager, portfolio-wide or large increases to leadership with finance told. Approvals are checked against who actually holds the role.
Measured against an honest baseline.
Without the system, the team still fixes every problem, just later: a payment fault after 10 days, late deliveries after 21, a search-traffic drop after 35. The agents are credited only for acting sooner and for better budget decisions.
A test it cannot memorise.
Each test business plants its 12 problems in different markets, lines and devices, so the held-out businesses are genuinely new. Prompts name no planted answer.
Deterministic engines, AI for judgement.
Statistics are code with tests: the same numbers every time. The agents decide what to look at, join evidence across sources, judge what is noise and explain. 96–98% of the numbers in their decisions trace back to tool results. The comparison with simpler setups shows where the weight sits: in the engines.
What a quarter looks like Simulated
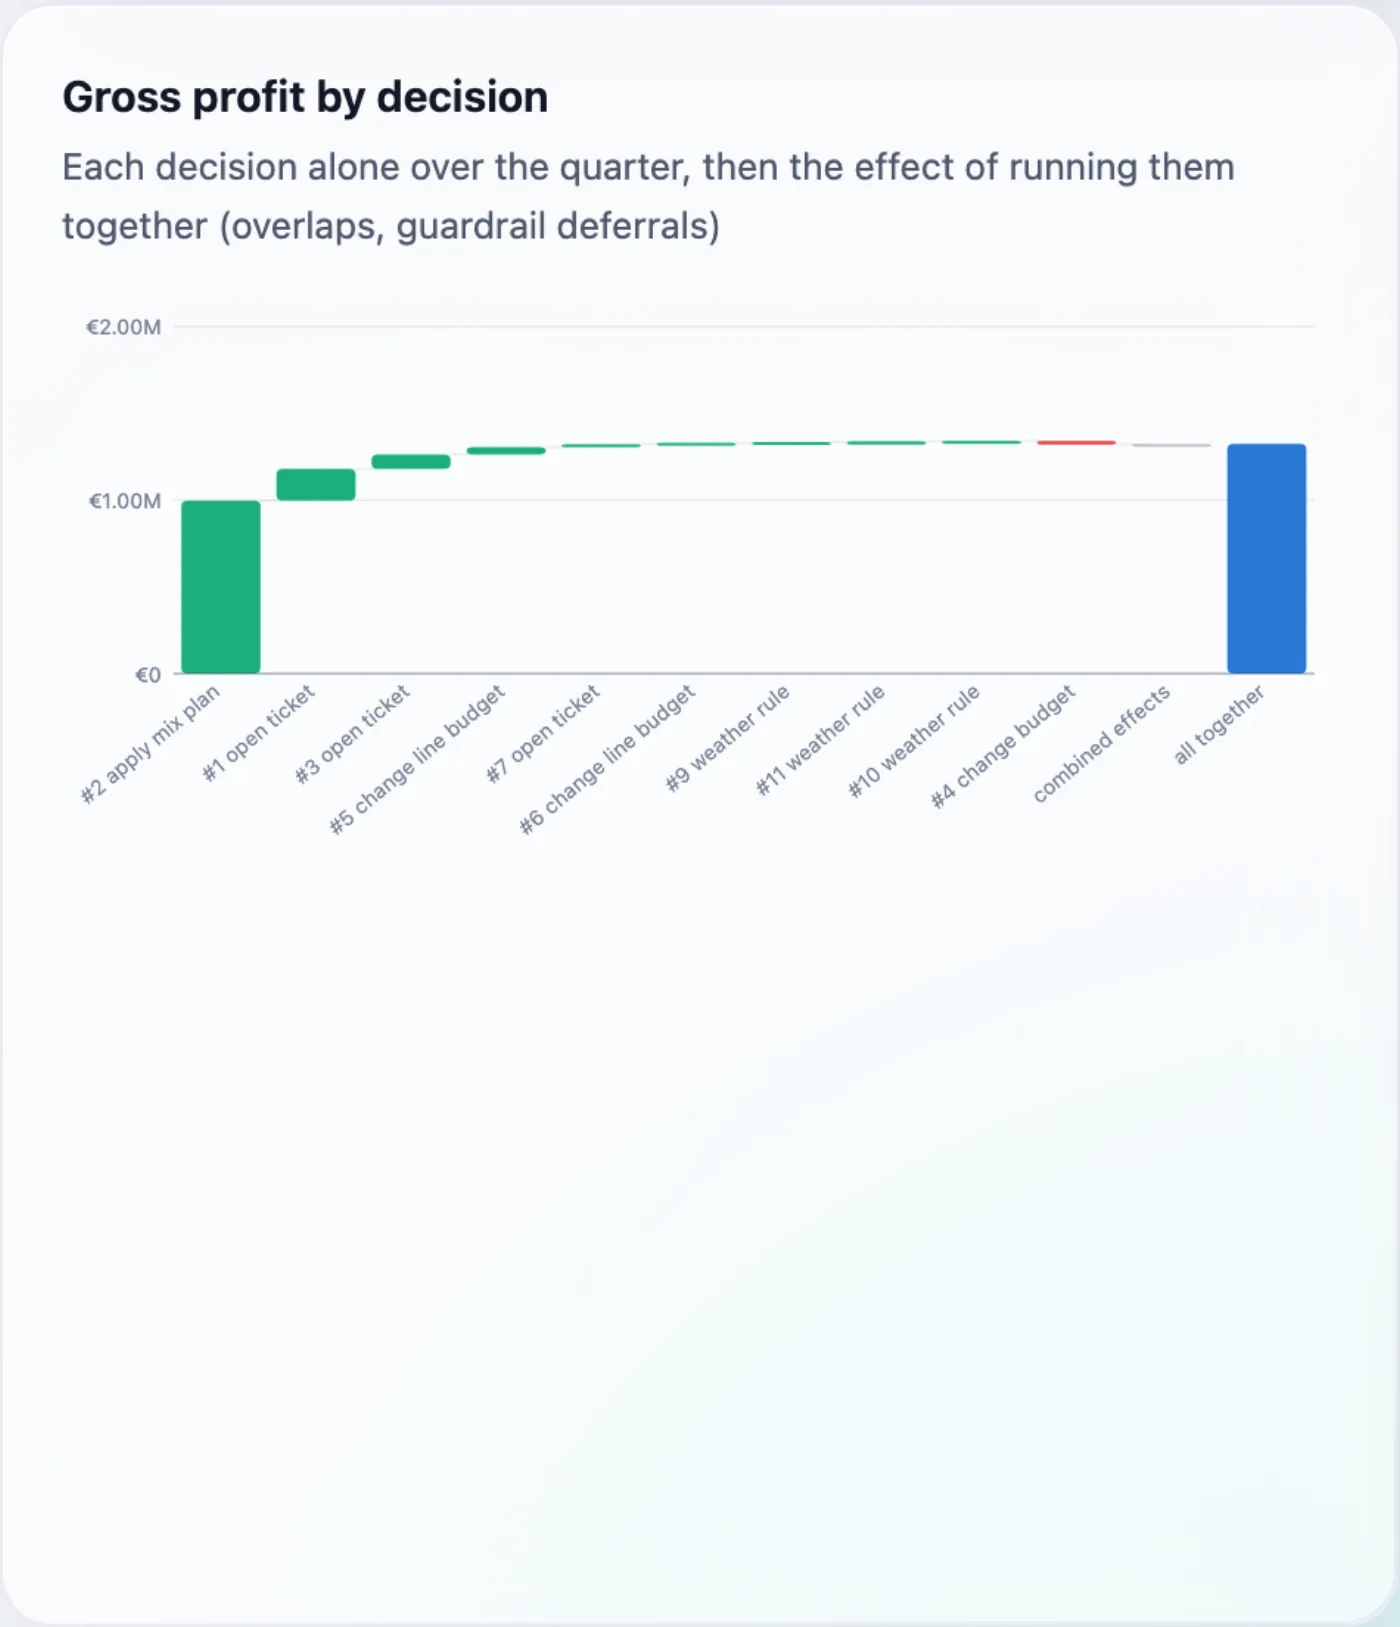
One weekly run on the synthetic business produced 12 decisions. Each was then run forward for 13 weeks twice from the same day with the same random draws: once approved, once not. The difference is what the decision was worth.
The largest gain came from applying the mix model’s channel split across the portfolio, approved by leadership: more to TikTok, YouTube, creators and generic search, less to channels past saturation, with no channel moved by more than its cap. A payment failure on iOS in two cities was caught and routed to engineering. A search-traffic drop after a site change was routed to SEO. Budget moved toward the market and line capturing the least of its potential demand, and three rain rules followed measured weather sensitivity.
Next quarter with every decision approved Simulated
| Revenue | +2.9% |
|---|---|
| Gross profit after marketing | +3.9% |
| Marketing spend | −1.1% |
| MER (revenue ÷ marketing) | 8.91 → 9.26 |
| Blended customer acquisition cost | −4.2% |
| Held-out businesses, gross profit | +2.7%, +4.6%, +3.9% |
In a real business the same comparison needs a holdout. The system plans one: which markets switch a channel off, for how many weeks, and the smallest change it could detect.
You decide, the quarter changes Simulated
The console opens on the AI’s 12 decisions as cards, each with the role that owns it and the money it is worth on its own. Approve or reject any of them and the quarter is recomputed. Wherever a choice matches a run that was actually simulated (everything approved, everything rejected, one decision left out, one decision alone) you see that run. Any other mix is shown as a sum of single runs and marked “≈”, because decisions interact.
One card should be rejected. Bringing London back to its budget loses €21k of gross profit on its own, and the run that leaves it out of the AI’s plan earns €20,141 more than approving everything. The point of the approval step is exactly this: the system is not right every time, so a person decides.
One decision, from signal to audit line Simulated
The largest problem the team found, followed through every step. Tags show where each number came from: linked means it appears in a result one of the agents’ tools returned; unlinked means it could not be traced.
- Signal. The benchmark analyst scanned iOS checkout-to-order rates in every market. Paris was at 34.8% over 28 days against a peer range of 61.7% to 62.4%, and Amsterdam was just as far out. linked
- Reasoning. The growth lead wrote: “On 14 Oct the iOS checkout success rate fell from 62% to 22% in both markets, across all lines. Other devices and other markets were unaffected, and payment complaints rose about 5× at the same time.” linked
- Money at stake. About €1.4M of revenue a month: €976k in Paris and €428k in Amsterdam. linked unlinked
- Owner. Not a marketing problem, so not a budget change: a low-risk ticket for engineering, routed to the Product owner, with the evidence attached (orders, checkouts, the release window to check, roll back if needed).
- Approval and execution. Approved by the Product owner. The executor’s audit line: “executed · ticket for engineering”.
- Measured. +€182,653 gross profit and +€362,266 revenue over the quarter for this decision alone, against a team that fixes the fault after 10 days instead of 3.
The live pilot
Real, not simulated
Growth OS also runs on a small web studio’s own funnel and Meta ad account, since 30 October 2026. There the executor may only pause or resume ads, and only after a person approves.
So far no ad has met a rule, so nothing has been paused or resumed. Results will be added here when there is something real to show, small as it will be.
The engines, in the console
Every view is built from the data at build time. Hover any mark for its numbers.
- Demand: captured share of potential demand by market and line; rain effect on orders with 95% ranges from real weather; the next 14 days of forecast rain per city.
- Benchmarks: each market against its peer range and its own last year, on checkout rate by device, MER, organic share and repeat-customer share.
- Budget: marginal ROAS by market and channel, response curves per channel, spend share against revenue share, and what each platform claims against first-party revenue.
- Customer voice: complaint themes by market across 11,024 comments, labelled for about two cents.
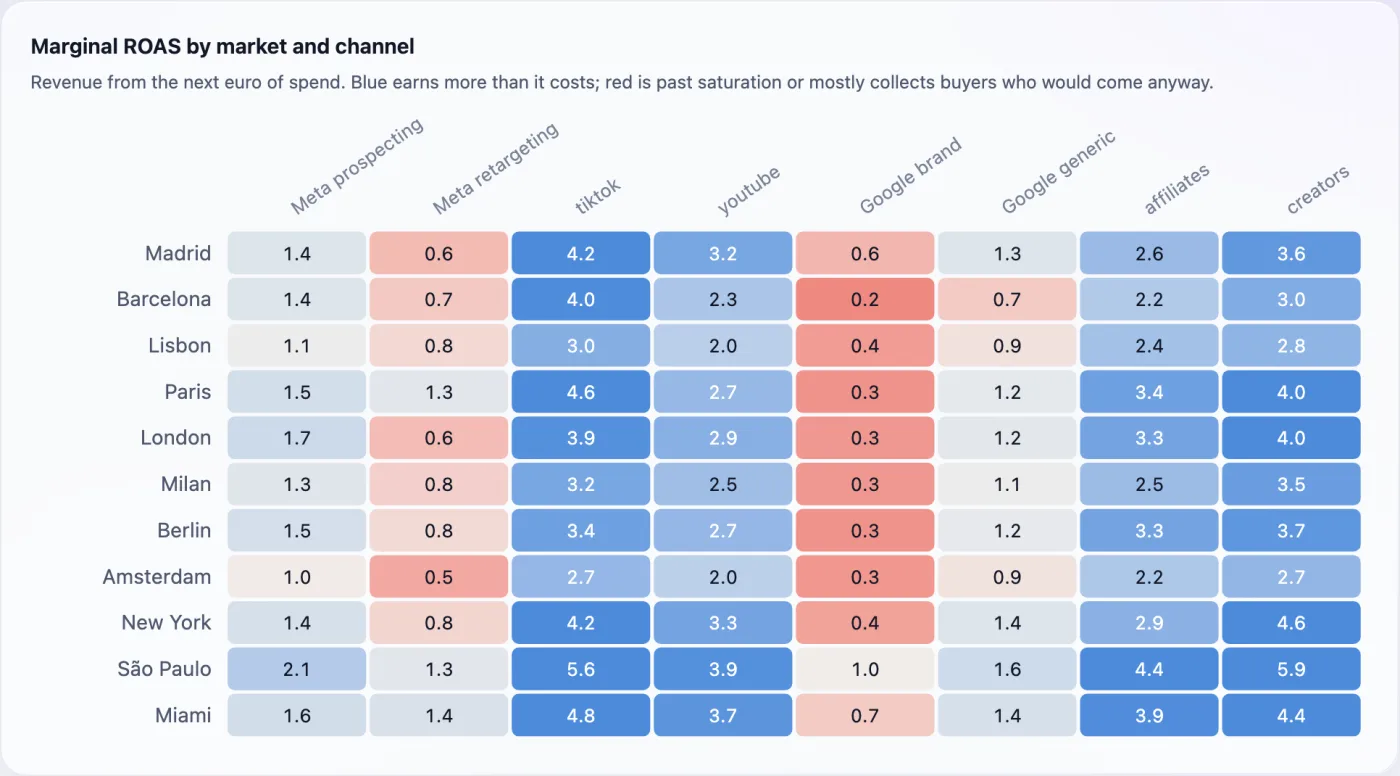
Views
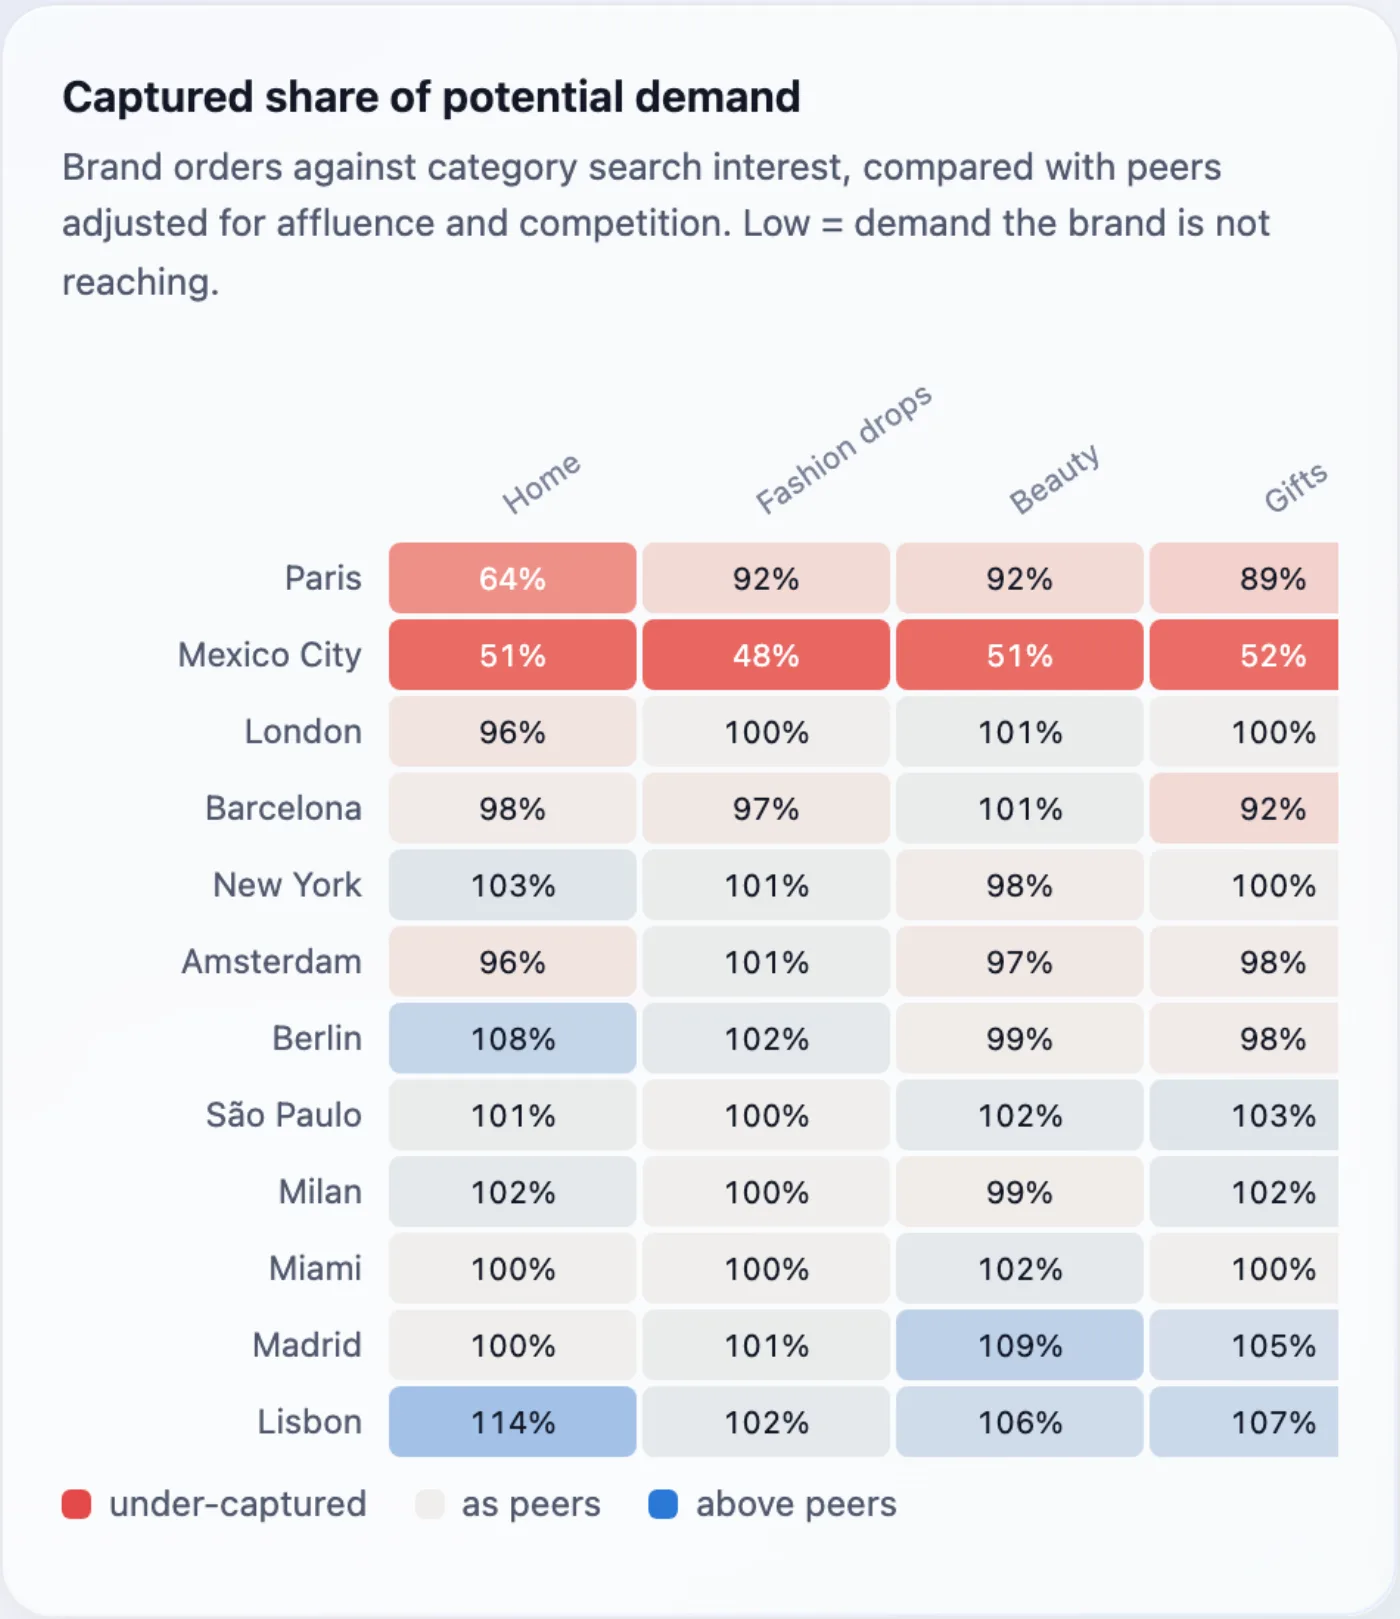
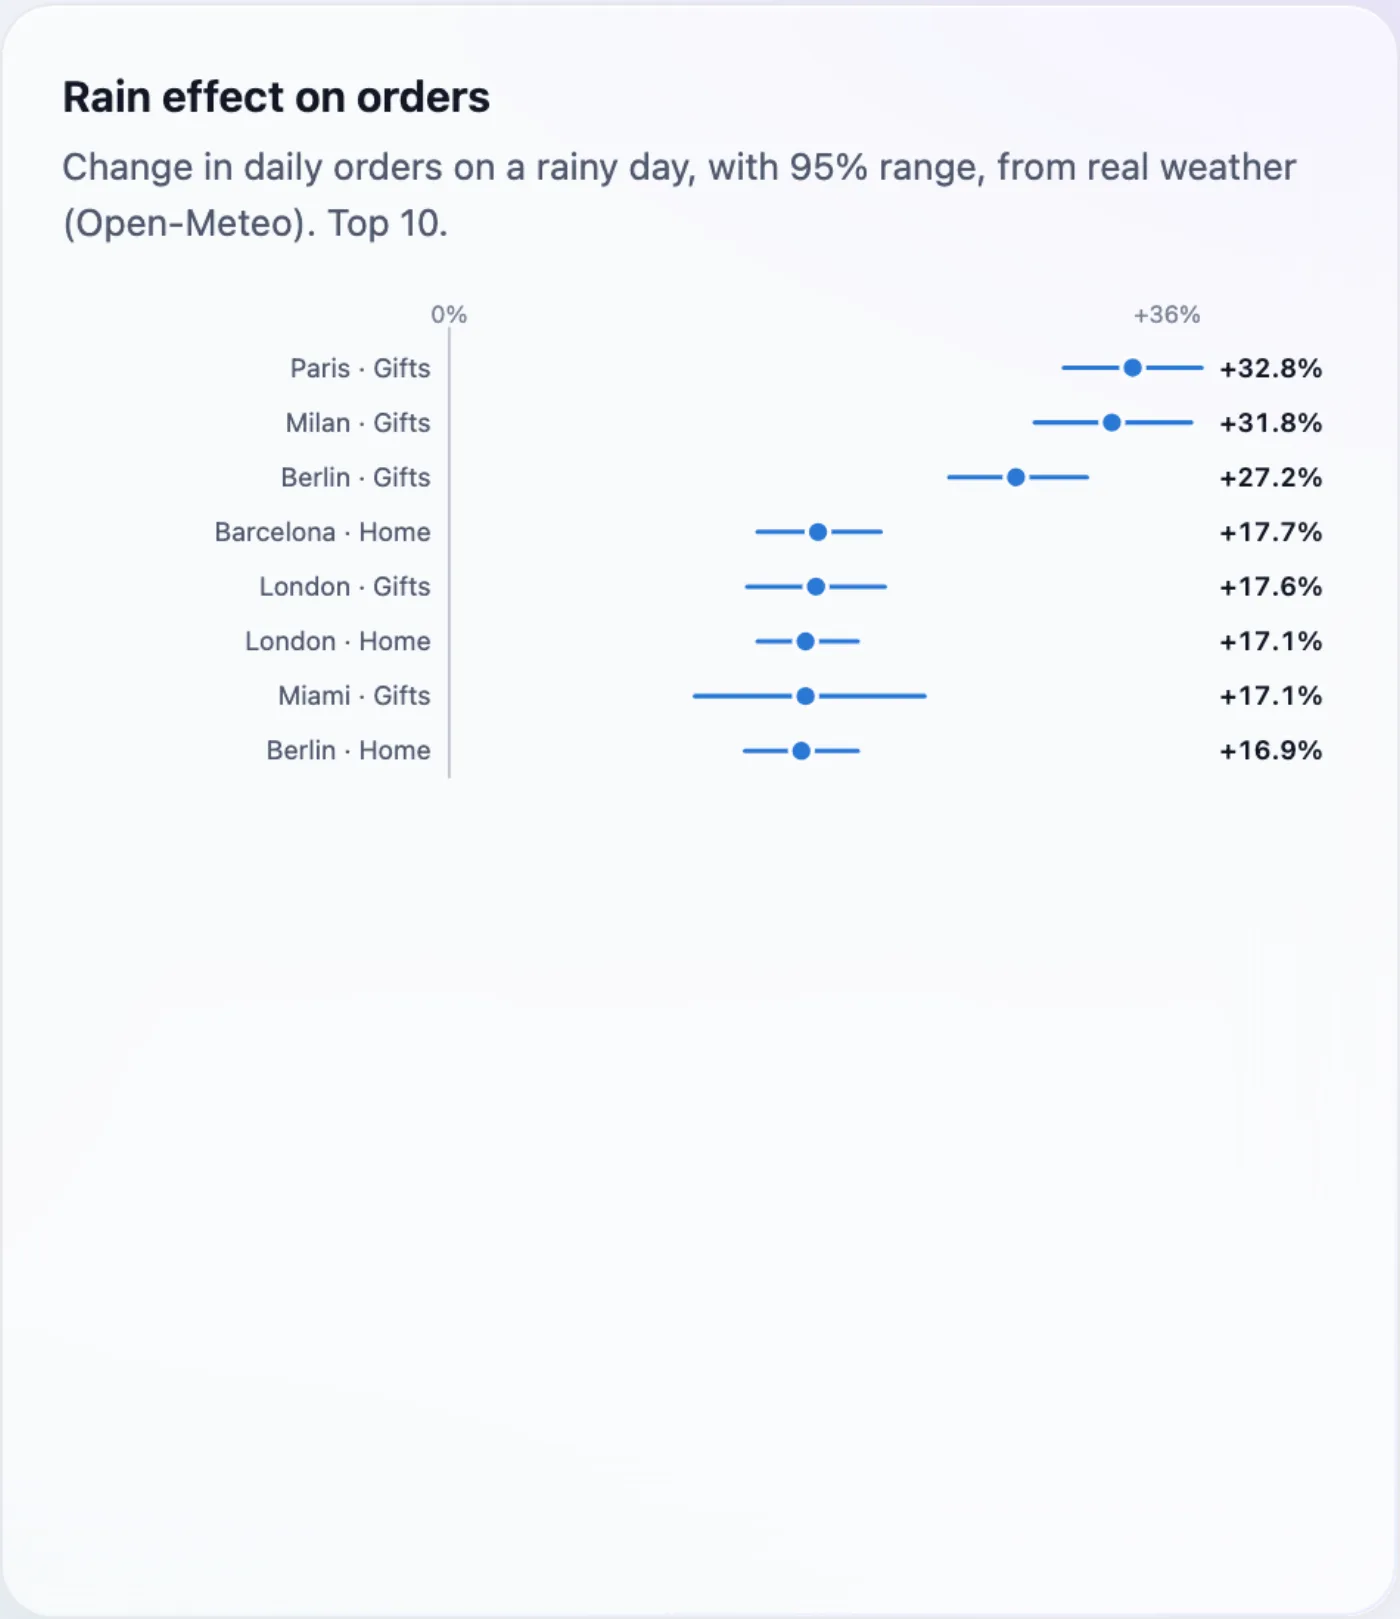
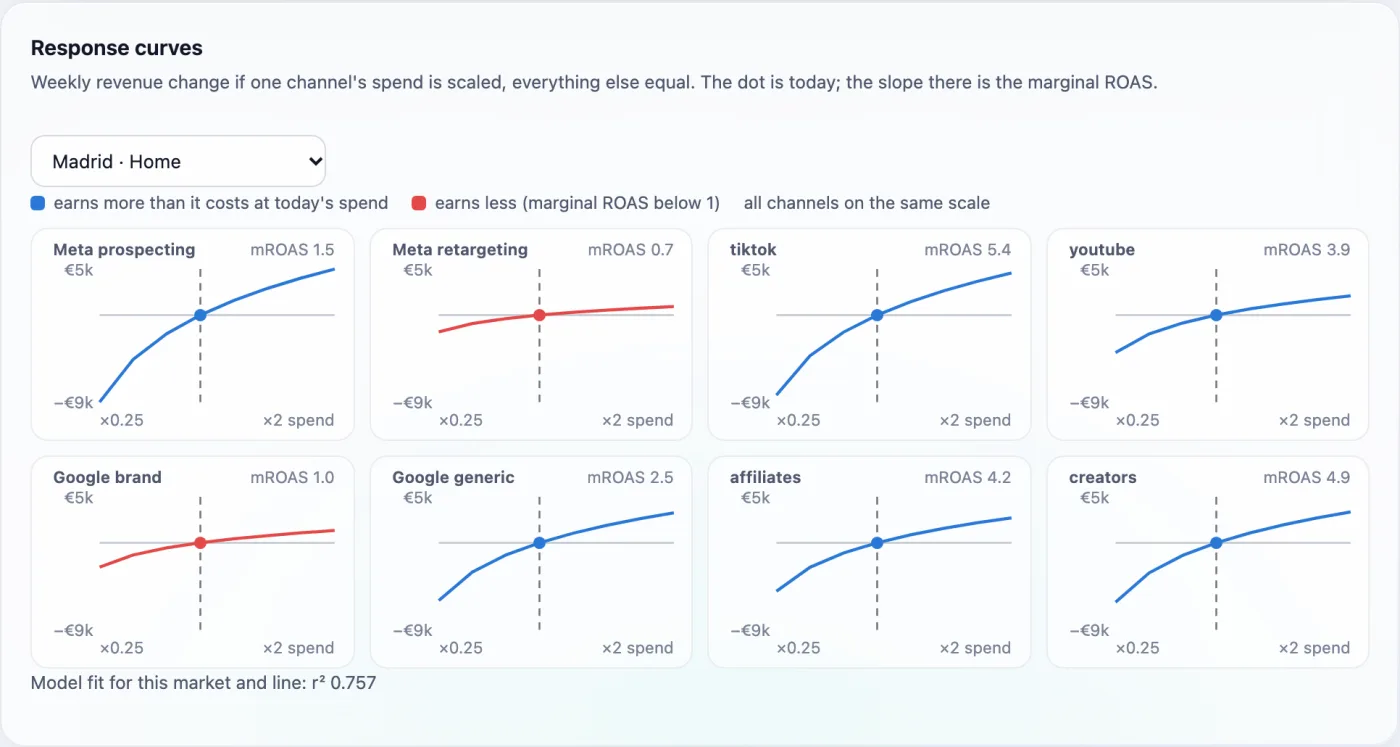
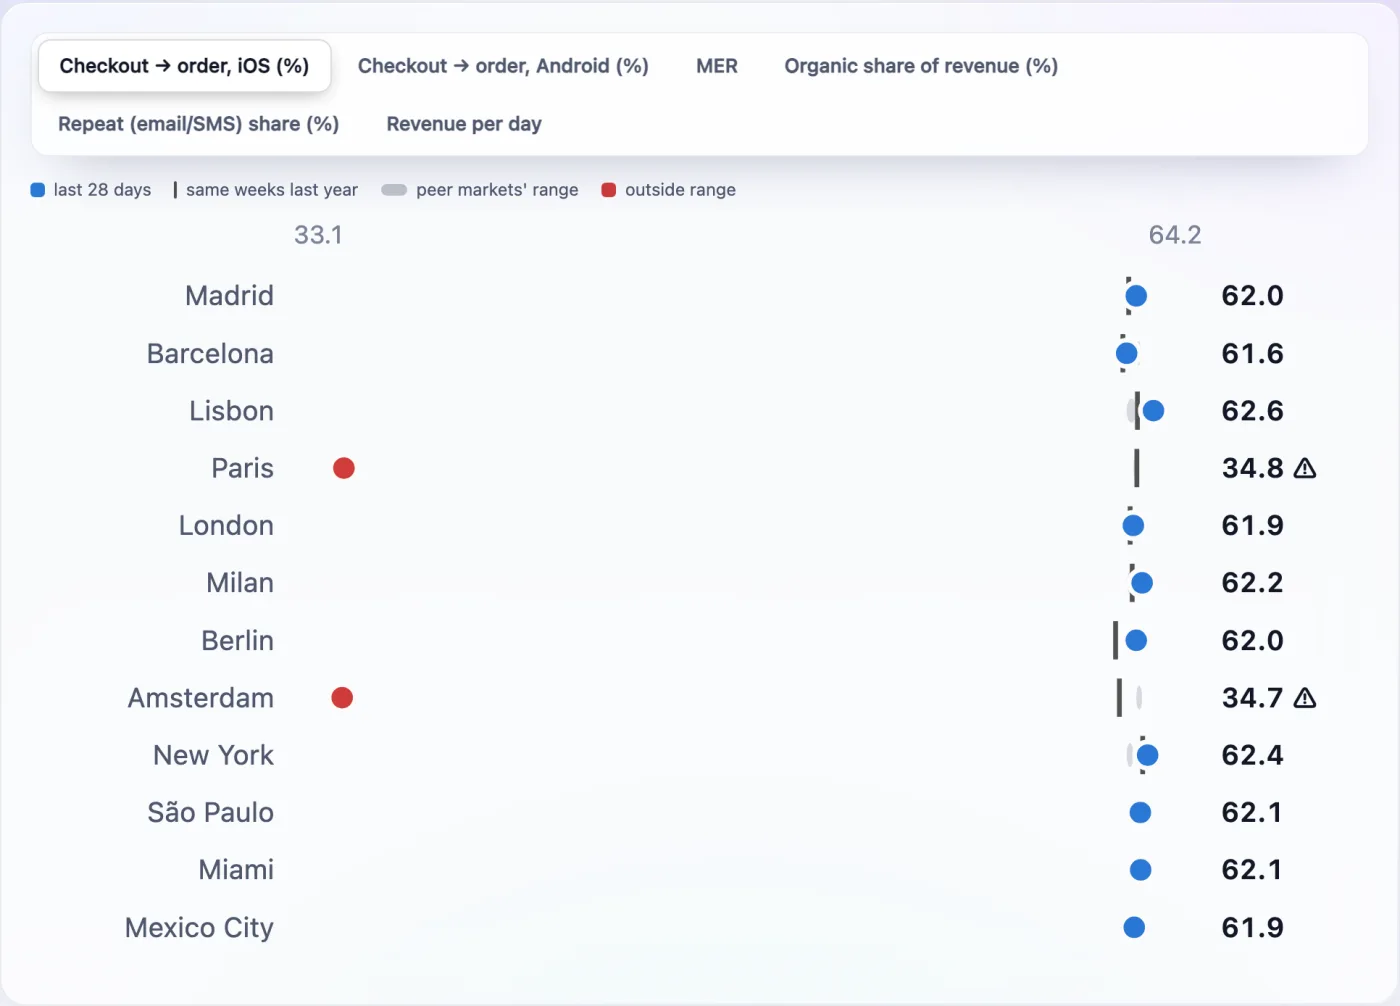
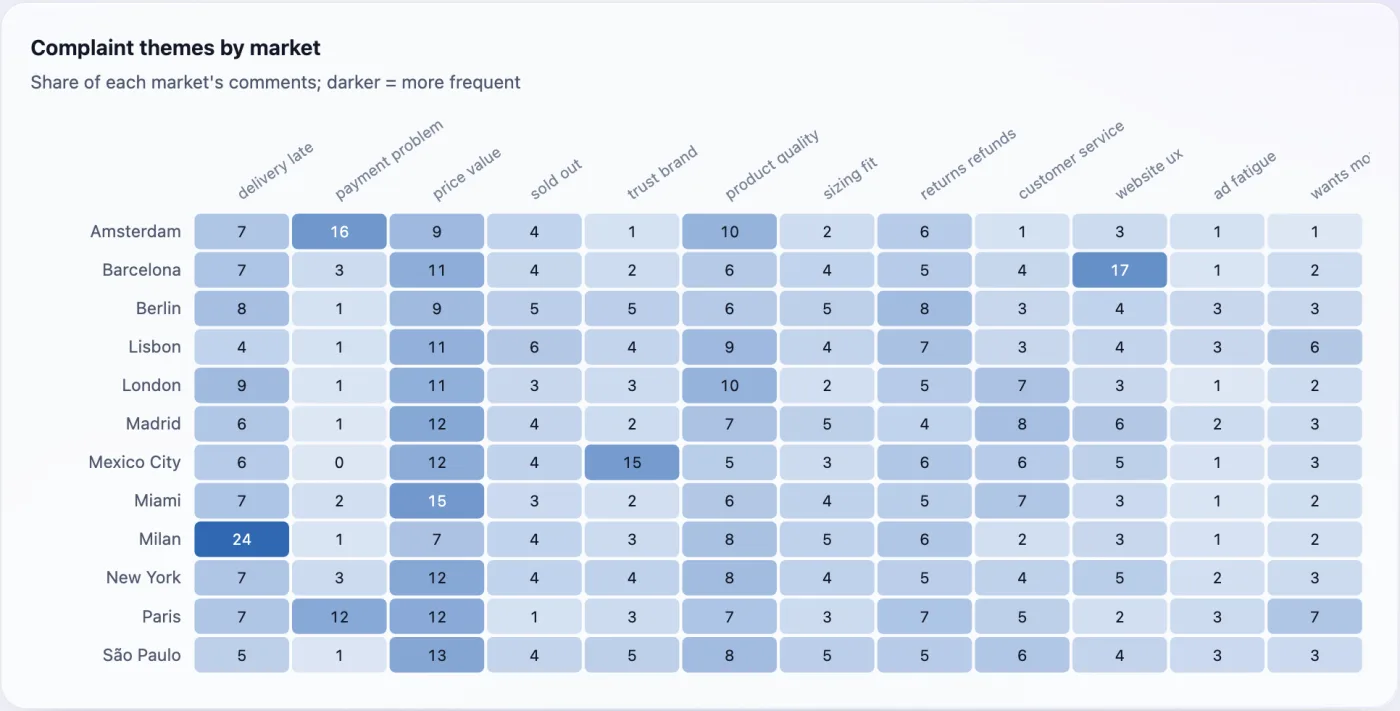
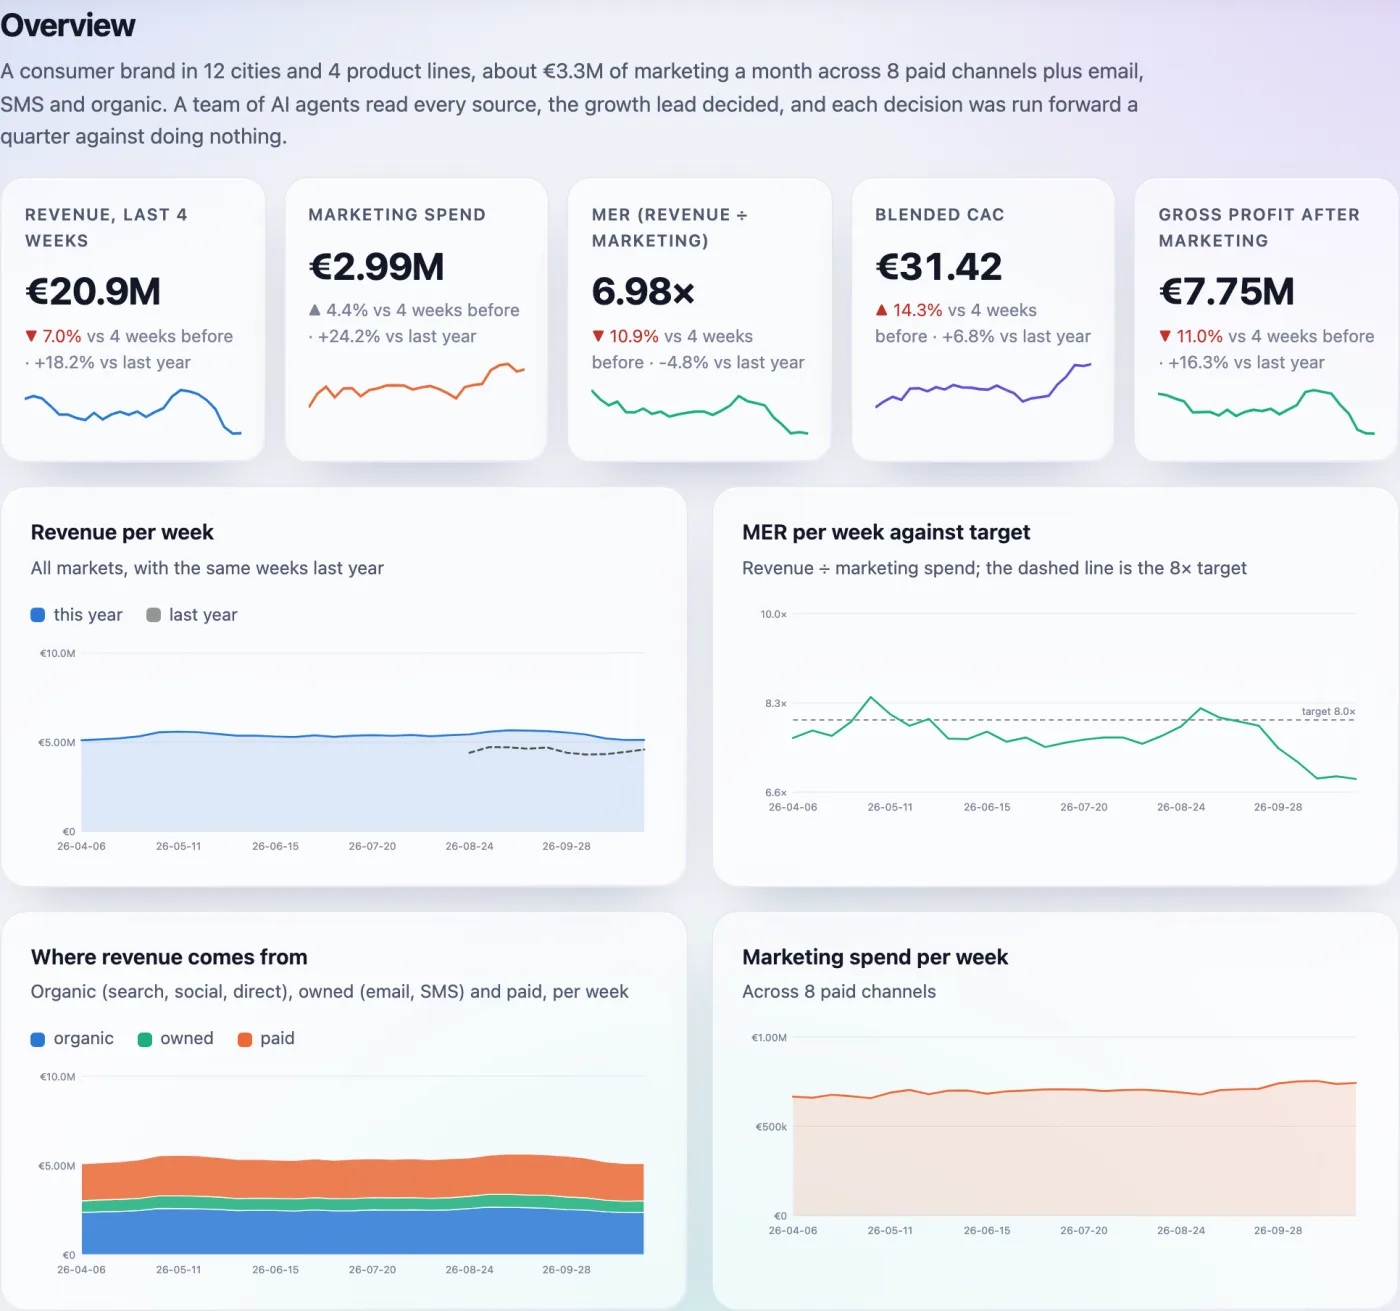
Screens from the live console, on the synthetic business.
What it gets wrong
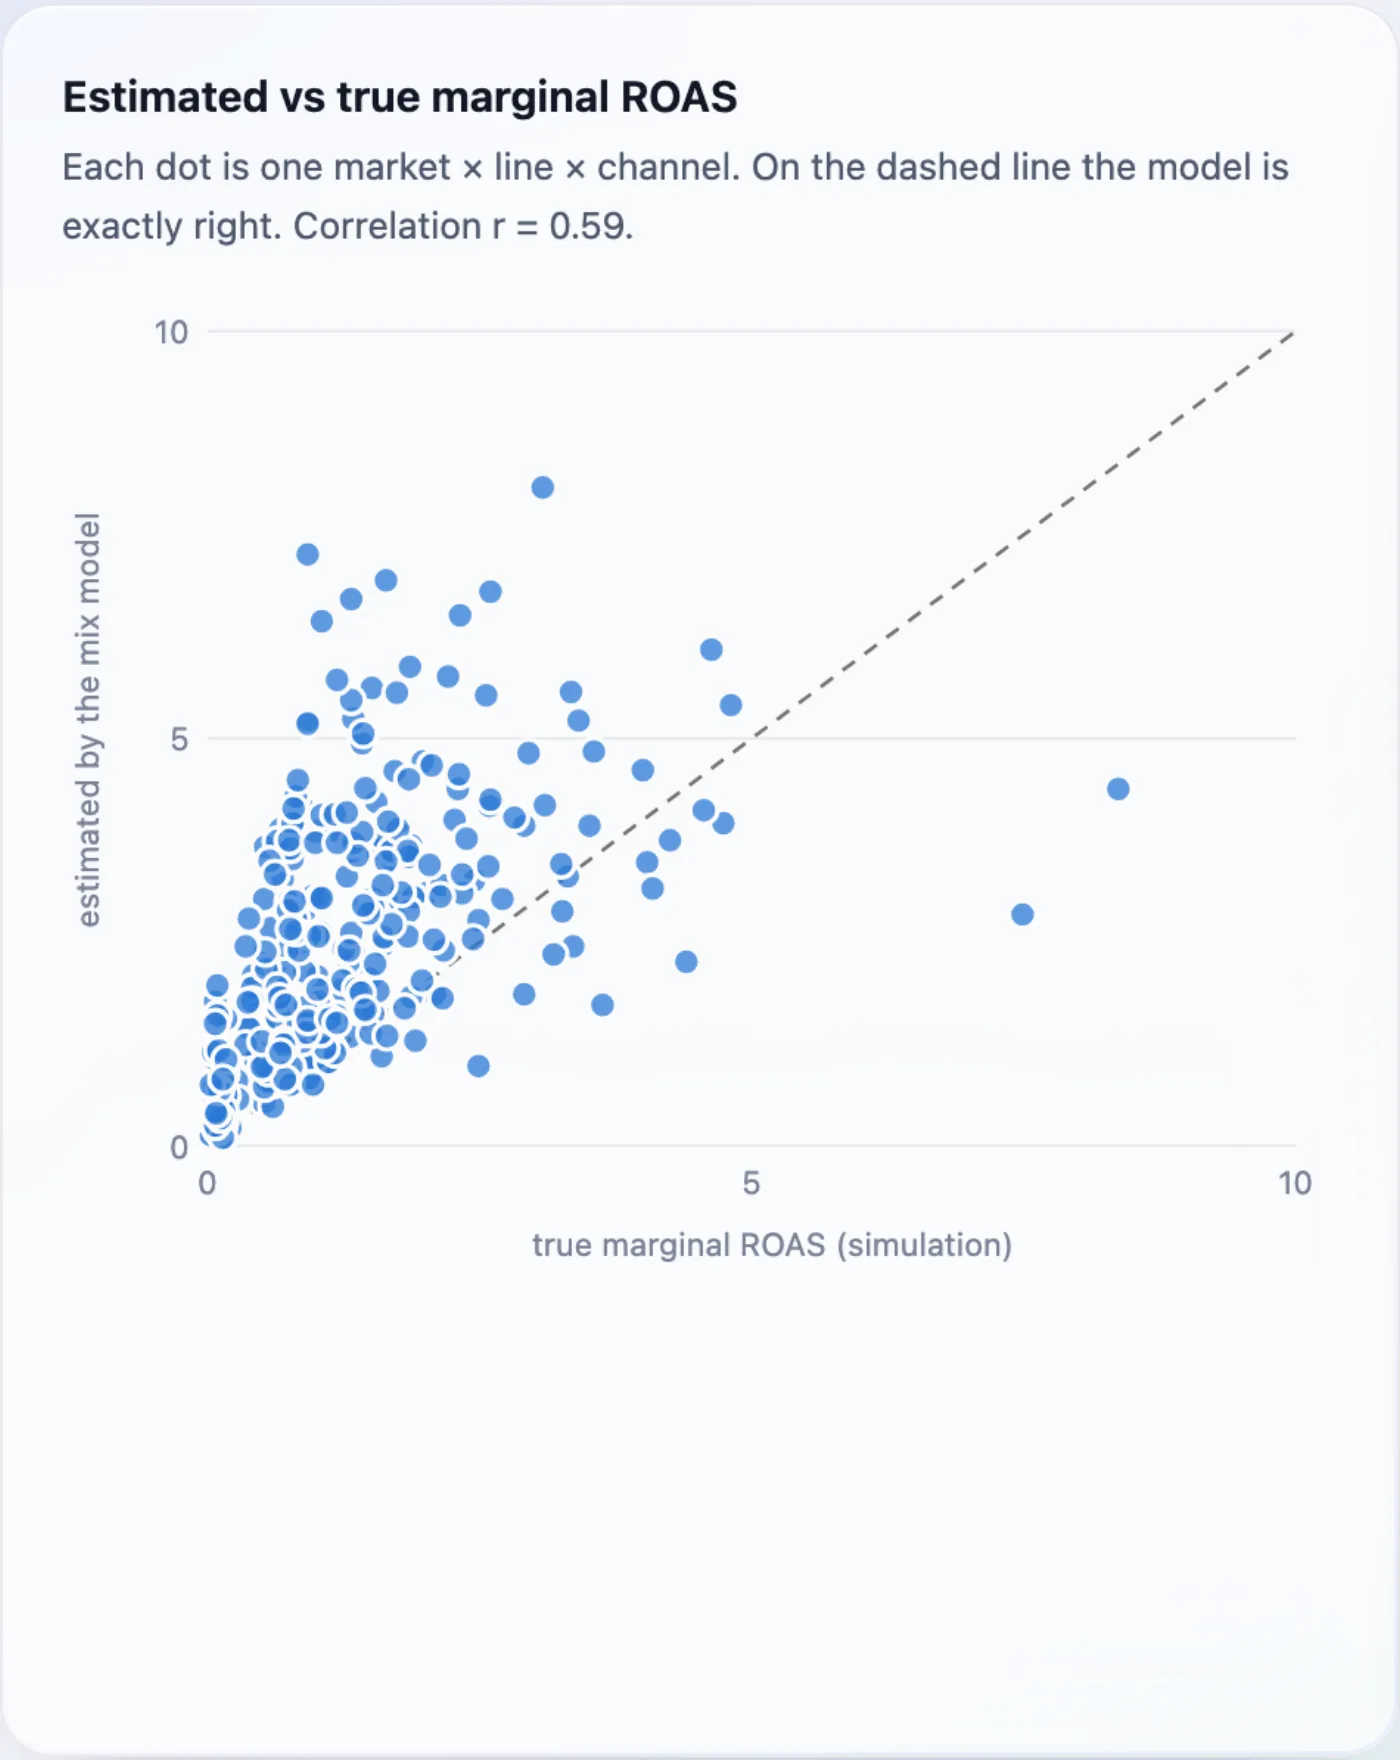
The console shows the model against the simulation’s hidden truth, where only a simulation can.
- The mix model overestimates marginal returns (correlation 0.59 with the truth) and does not reliably flag Meta prospecting saturation. The agents then blame brand search and retargeting instead. The AI grader marks it missed on all three held-out businesses, and both simpler setups miss it too: the error is in the model, not the agents. A person re-grading the checks passed the team on it.
- A real demand gap was found but dismissed as long-standing in two of three.
- A search-traffic drop hidden by extra paid spend was not tied to its cause in two of three.
- Once, the lead cut a line’s budget on a poorly fitting model in a market that only had noise.
- The AI grader agrees with a person on 37 of 45 checks (Cohen’s kappa 0.24): stricter on six, more lenient on two. Any single check is uncertain; read the totals as plus or minus a few.
How it scales
- The hub is a schema, not a product: the same tables on BigQuery, Snowflake or Postgres, one connector per source. Mixpanel, Microsoft Clarity and Hotjar connectors are included and tested on sample payloads.
- One weekly run for the whole portfolio costs about $2.50, with a hard cost cap per run; one run per region works the same way.
- Autonomy widens one action type at a time, only where the audit log shows approvals were right.
- Rollout in four phases with exit criteria: reconcile numbers, shadow, assisted, scale.
Evidence beyond the simulation
- Real public data: an online marketplace’s funnel and 3,000 reviews; a public Facebook ads dataset where one audience took 20% of spend at 4.5× the cost per buyer, and 207 ads with no spend were credited with 76 buyers.
- The analyst agent on its own passed 68/70 and 58/60 graded checks on businesses it never saw.
Tech stack
- Python 3.12
- Claude Opus 5.5 (agents)
- Claude Haiku 5.5 (Batch API)
- MCP server
- SQLite hub, warehouse-portable
- Marketing-mix model (log-log, pooled with shrinkage)
- Slack approvals (signed endpoint)
- Open-Meteo weather
- Nager.Date holidays
- Static SVG dashboard, no libraries
- pytest and node:test (63 tests)
The business is synthetic and every outcome is simulated, with the assumptions shown in the console. Real inputs: weather from Open-Meteo (CC BY 4.0), public holidays from Nager.Date, public datasets from Kaggle (CC BY-NC-SA 4.0). Rounded metro populations are public figures used only as size inputs. Claude is the model used; this is an independent project, not endorsed or sponsored by Anthropic.
Next projectSpain Open Data