Location Intelligence
Choosing restaurant sites with numbers, not gut feel
Overview
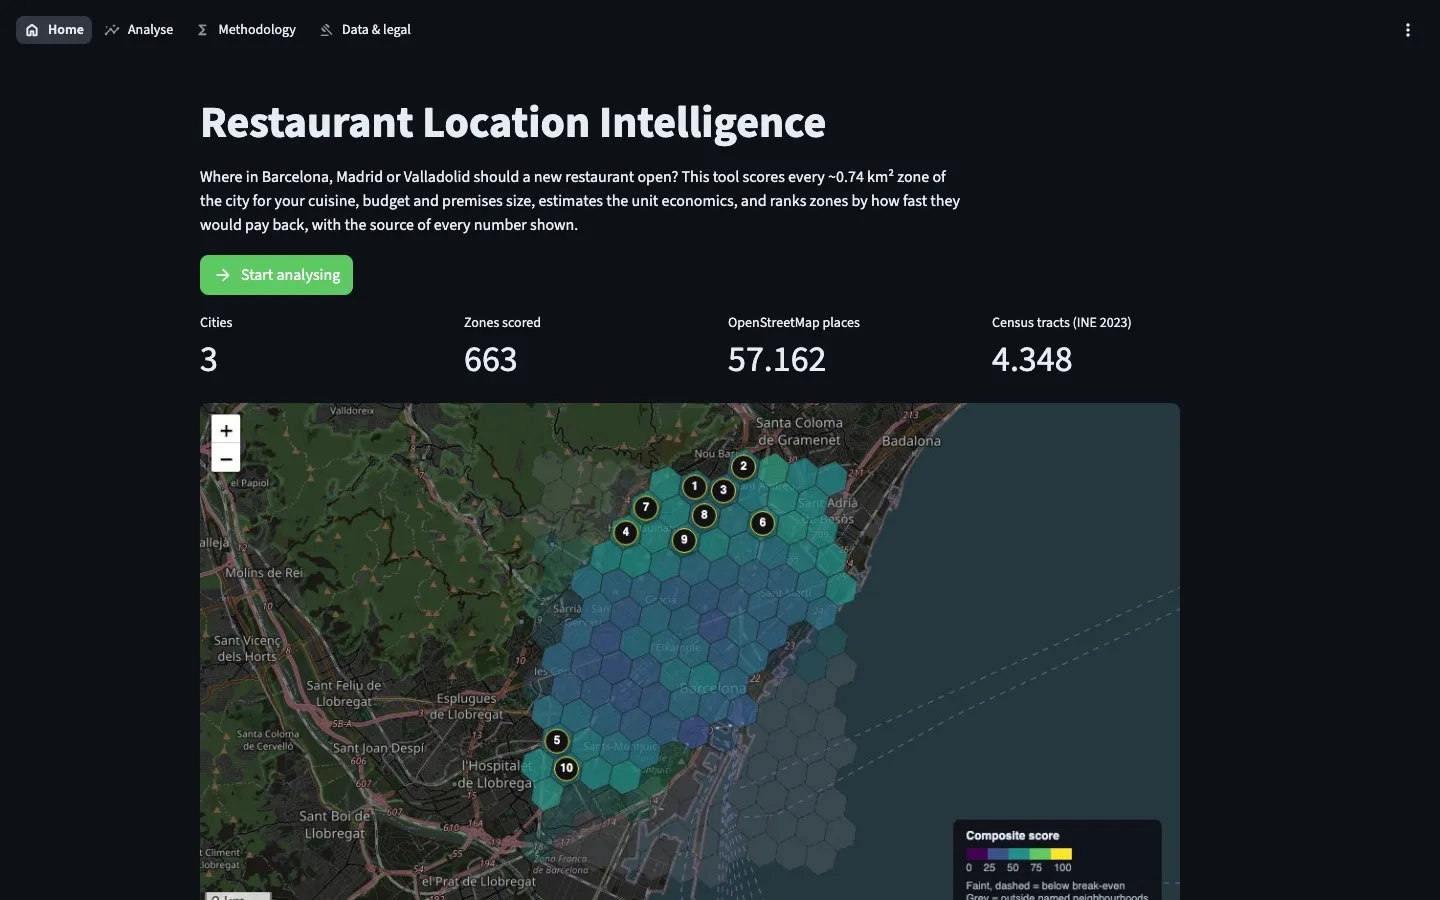
A tool that ranks every small zone of a city by restaurant unit economics, and shows where every input came from.
The problem
Choosing a location is the most expensive decision an independent restaurant makes, and it is usually made on gut feel and a broker’s deck. A wrong lease can sink a good kitchen.
The approach
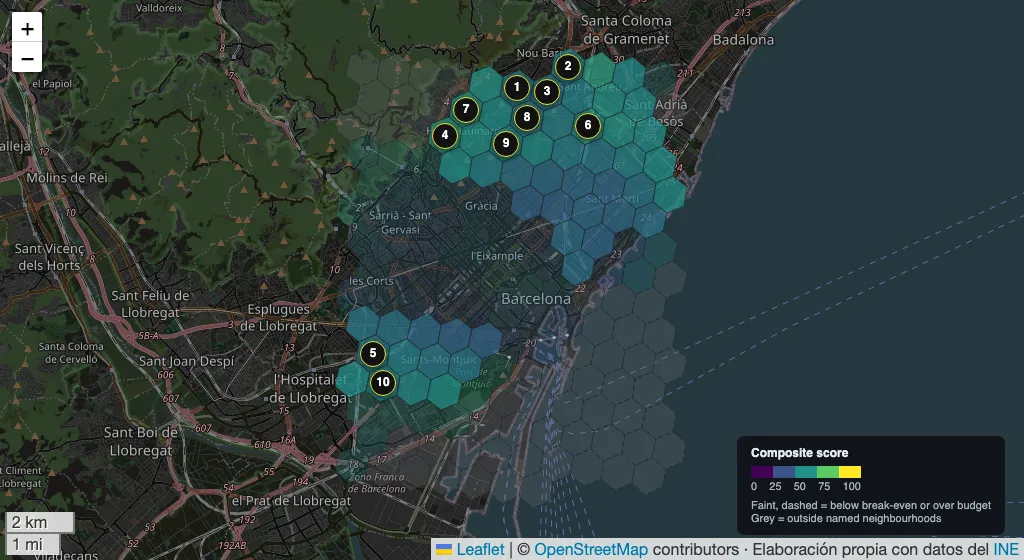
- Every city is split into hexagonal zones of about 0.74 km². For each zone the tool estimates demand from residents and visitors, reduced by same-cuisine competitors and capped at seat capacity.
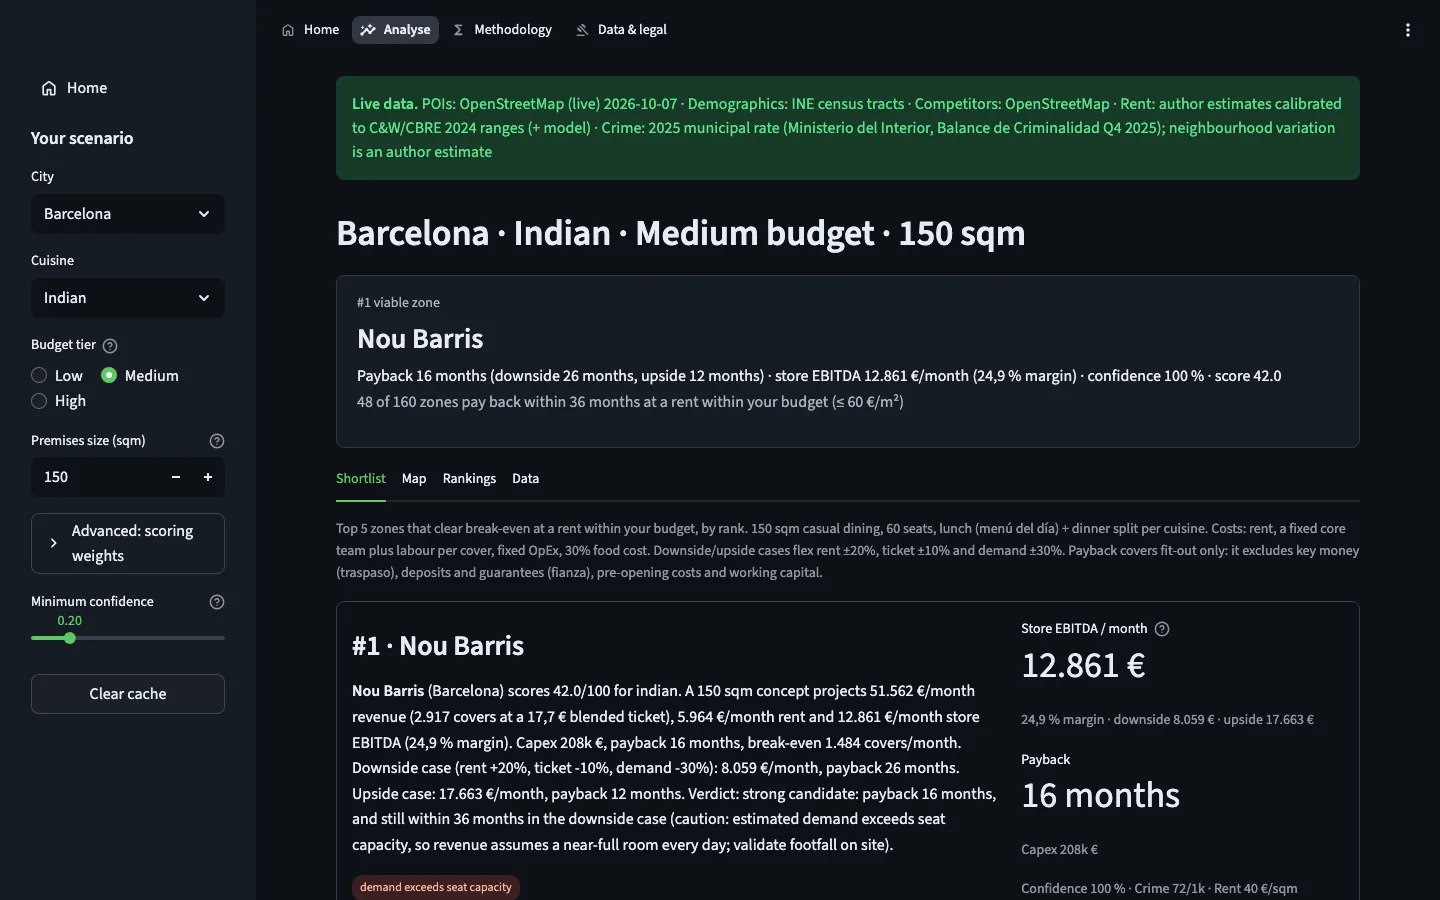
- Full unit economics per zone: revenue, rent, labour, food cost, EBITDA, break-even and payback, with a downside and an upside case.
- Eight component scores, from competition gap to foot traffic (estimated from shops, offices and transit) and income match, combined into one score with weights you can change.
- Provenance first: the first thing on screen is where the data came from. Demographics and competitors are real data; rent is still an estimate from public broker ranges, so every verdict says so and the downside case adds 20% to rent.
What I built
Pick a city, a cuisine, a budget and a premises size. Get a ranked shortlist, economics first, with a map, deal briefs and exportable data, for Barcelona, Madrid and Valladolid.
Limits
The demand model is not yet calibrated against real openings and closures. Treat the shortlist as where to look on foot, not where to sign.
See it in use
Recorded from the live demo. Figures are model estimates from open data.
Decision log
Three calls that shaped this project, and why I made them.
-
Economics decide the rank; the score only colours the map
- Context
- A weighted score across eight signals is easy to build, and easy to tune until it says what you hoped. An operator wants to know one thing: will this site pay back?
- Decision
- The ranking comes from unit economics, with viable zones first, sorted by payback; the composite score colours the map and breaks ties.
- Why
- The two views are independent, so the score cannot inflate the revenue. The same rank appears on the map, in the table and in every brief, so there is one answer, not three.
-
Verdicts say what they rest on
- Context
- Some inputs fall back to estimates or synthetic data. Without census-tract demographics, every zone in a city shares the same resident demand.
- Decision
- Where the data came from is the first thing on screen. A go/no-go verdict needs INE census-tract demographics and live OpenStreetMap competitors; rent is still an estimate, so every verdict says so.
- Why
- Without tract demographics every zone shares the same demand, so no verdict is shown. With them, the shortlist is worth walking, and the estimated rent is flagged next to every payback.
-
Open data first, and no scrapers
- Context
- Listing portals and Google Places would add detail on rents and competitors, but portals forbid scraping, Spanish law protects their databases, and Google’s terms limit how Places data can be shown and stored.
- Decision
- The public tool runs on OpenStreetMap and INE’s household income atlas; Places stays optional and private, and CI rejects it if committed; rents come in through an importer for data you are licensed to use.
- Why
- The demo has to be lawful and shareable. With the importer in place, better rent data is a purchase decision, not a rebuild.